Mexico weather by month
Average temperatures and rainfall across Mexico, based on 30 years of climate data.
The average temperature in Mexico is around 15° across the year, though it swings month to month and from region to region. The figures below show the monthly pattern for Mexico City.
- Hottest
- Apr
- 25°
- Coldest
- Jan
- 5°
- Wettest
- Sep
- 173 mm
- Driest
- Dec
- 17 mm
- Annual avg
- 15°
- year-round
- Rain / yr
- 976 mm
- 141 wet days
- Largest city
- Mexico City
- 12,294k people
- Cities
- 650
- with climate data
Monthly climate (Mexico City)
Average highs, lows and rainfall through the year for Mexico City, Mexico's largest city.
| Month | High / Low | Rainfall | Wet days |
|---|---|---|---|
| Jan | 20° / 5° | 23 mm | 4.5 |
| Feb | 22° / 6° | 19 mm | 4.2 |
| Mar | 24° / 7° | 30 mm | 6.3 |
| Apr | 25° / 9° | 49 mm | 8.9 |
| May | 24° / 11° | 75 mm | 12.3 |
| Jun | 23° / 12° | 151 mm | 17.4 |
| Jul | 22° / 11° | 152 mm | 22.8 |
| Aug | 22° / 11° | 159 mm | 21.9 |
| Sep | 21° / 11° | 173 mm | 20.3 |
| Oct | 21° / 9° | 95 mm | 13 |
| Nov | 20° / 7° | 33 mm | 6.5 |
| Dec | 20° / 5° | 17 mm | 3 |
Weather across Mexico
Climate varies from region to region. León de los Aldama is the warmest of these cities, averaging 20° — about 5° warmer than Mexico City, the coolest.
| City | Through the year | Avg | Warmest | Best month |
|---|---|---|---|---|
| Mexico City Mexico City | 15° | 17° (Apr) | Feb | |
| Tijuana Baja California | 17° | 21° (Aug) | Aug | |
| Puebla Puebla | 18° | 20° (Apr) | Feb | |
| Ecatepec de Morelos Mexico | 17° | 20° (May) | Feb | |
| Santiago de Querétaro Queretaro | 18° | 22° (May) | Dec | |
| León de los Aldama Guanajuato | 20° | 24° (May) | Dec |
Climate in Mexico City
Full Mexico City forecastMexico City is the largest city in Mexico; its cloud cover, humidity, wind and sunshine are typical of the surrounding region.
Clouds and sunshine
How often the daytime sky is clear, partly cloudy or overcast through the year.
In Mexico City, the average share of the sky covered by clouds shows significant seasonal variation over the course of the year.
The clearer part of the year begins around October 29 and lasts for 7.0 months, ending around May 29. The clearest month is March, when the sky is clear, mostly clear, or partly cloudy 78% of the time on average.
The cloudier part of the year begins around May 30 and lasts for 5.0 months, ending around October 28. The cloudiest month is September, when it is overcast or mostly cloudy 76% of the time.
Humidity comfort
Share of days at each humidity comfort level, based on the dew point — the measure that tracks how muggy it actually feels.
Wind
Average wind speed through the year, banded into plain-language speed zones so a number reads as 'breezy' or 'calm' without knowing the scale.
This is the average sustained wind speed at the standard 10 metres above open ground — the steady flow a weather station reports, not the sharper gusts that come and go, which can run half again as fast. It's the number that says whether a place is generally breezy or calm.
Wind in Mexico City is steady company: average speeds sit near 6 km/h — calm — in every month of the year, with no meaningful windy or calm season.
| Jan | Feb | Mar | Apr | May | Jun | Jul | Aug | Sep | Oct | Nov | Dec | |
|---|---|---|---|---|---|---|---|---|---|---|---|---|
| Wind speed (km/h) | 6 | 7 | 7 | 7 | 6 | 6 | 6 | 6 | 6 | 6 | 6 | 6 |
| Feels | calm | calm | calm | calm | calm | calm | calm | calm | calm | calm | calm | calm |
| Wind speed (km/h) | Feels | |
|---|---|---|
| Jan | 6 | calm |
| Feb | 7 | calm |
| Mar | 7 | calm |
| Apr | 7 | calm |
| May | 6 | calm |
| Jun | 6 | calm |
| Jul | 6 | calm |
| Aug | 6 | calm |
| Sep | 6 | calm |
| Oct | 6 | calm |
| Nov | 6 | calm |
| Dec | 6 | calm |
Best time to visit Mexico
A 0–10 score combining daytime comfort, chance of rain and cloud cover — the sweet spot runs early January to early June.
Solar energy
Average daily shortwave solar energy reaching the ground, banded into brightness zones so the number means something at a glance.
Solar energy is how much sunlight actually reaches the ground each day, measured in kilowatt-hours per square metre (kWh/m²) — the combined effect of how long the sun is up, how high it climbs, and how much cloud gets in the way. It's the raw fuel a solar panel has to work with: for scale, 1 kWh/m² a day is dim and wintry, while 7+ is desert-bright.
Mexico City receives about 5.7 kWh/m² a day of solar energy on average — bright — with a clear seasonal swing between 4.8 and 7.0 kWh/m².
The brighter stretch of the year lasts 4.3 months, from around Feb 12 to Jun 23. The brightest month is April, averaging about 7.0 kWh/m² (intense).
The dimmest month is December, down near 4.9 kWh/m² — roughly 30% less than the April peak.
Where is Mexico?
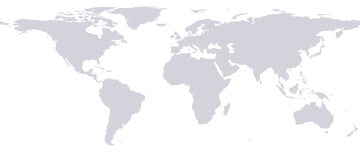
Mexico sits around 19.4°N, 99.1°W. The marker shows Mexico City, its largest city, among 650 cities with climate data here.
Mexico travel facts
- Travel advisory
- Level 2
- Exercise Increased Caution
- Power plugs
- Type A / B
- 120 / 127 V · 60 Hz
- Prices
- ≈ 54% of US
- price level, 2025
- GDP per capita
- $13,889
- 2025
- Happiness
- 7.0 / 10
- World Happiness, 2025
- Safe drinking water
- 43%
- of population, 2024
- Homicide rate
- 24.9
- per 100k, 2023
- Road deaths
- 12.8
- per 100k/yr, 2019
- Income group
- Upper middle
- World Bank
- English
- Very low
- EF EPI 440
- Religion
Sources: World Bank, US State Department, World Happiness Report, WHO/UNICEF, EF EPI, CIA World Factbook.
Largest cities in Mexico
- 1Mexico City12°–17°12.3MFeb
- 2TijuanaBaja California13°–21°1.9MAug
- 3IztapalapaMexico City11°–17°1.8MFeb
- 4Puebla15°–20°1.7MFeb
- 5Ecatepec de MorelosMexico14°–20°1.6MFeb
- 6Santiago de QuerétaroQueretaro14°–22°1.6MDec
- 7León de los AldamaGuanajuato16°–24°1.6MDec
- 8Ciudad JuárezChihuahua7°–28°1.5MApr
- 9ZapopanJalisco17°–24°1.5MJan
- 10GuadalajaraJalisco17°–24°1.4MDec
- 11MeridaYucatan23°–29°1.2MJan
- 12Gustavo Adolfo MaderoMexico City14°–20°1.2MFeb
- 13MonterreyNuevo Leon14°–28°1.1MNov
- 14Ciudad NezahualcoyotlMexico14°–20°1.1MFeb
- 15MexicaliBaja California14°–35°1.0MFeb
- 16Chihuahua10°–28°926kMar
- 17CancunQuintana Roo24°–28°889kMar
- 18Naucalpan de JuárezMexico12°–17°834kFeb
- 19HermosilloSonora16°–32°812kJan
- 20CuliacánSinaloa19°–30°808kJan
- 21MoreliaMichoacan15°–21°743kFeb
- 22TorreónCoahuila15°–29°735kNov
- 23Álvaro ObregónMexico City10°–15°727kFeb
- 24San Luis PotosíSan Luis Potosi12°–21°723kFeb
- 25Aguascalientes13°–22°722kNov
- 26SaltilloCoahuila11°–22°710kMar
- 27GuadalupeNuevo Leon14°–28°674kNov
- 28AcapulcoGuerrero26°–28°659kFeb
- 29TlalnepantlaMexico12°–17°653kFeb
- 30TlaquepaqueJalisco17°–24°650kDec
- 31CoyoacánMexico City10°–15°614kFeb
- 32TuxtlaChiapas20°–24°604kJan
- 33ReynosaTamaulipas16°–30°589kFeb
- 34TlalpanMexico City10°–15°575kFeb
- 35Cuautitlán IzcalliMexico13°–19°555kFeb
- 36CuauhtémocMexico City12°–17°532kFeb
- 37Victoria de DurangoDurango10°–21°519kMar
- 38Heroica MatamorosTamaulipas17°–29°511kFeb
- 39TolucaMexico10°–15°489kMar
- 40Ciudad López MateosMexico12°–17°489kFeb
- 41Ciudad ApodacaNuevo Leon14°–28°467kNov
- 42Ciudad General EscobedoNuevo Leon14°–28°455kNov
- 43EnsenadaBaja California12°–23°444kJun
- 44XochimilcoMexico City11°–17°442kFeb
- 45Venustiano CarranzaMexico City14°–20°431kFeb
- 46Veracruz22°–29°428kJan
- 47Xalapa de EnríquezVeracruz13°–18°425kFeb
- 48Nuevo LaredoTamaulipas15°–31°416kNov
- 49AzcapotzalcoMexico City12°–17°415kFeb
- 50San Nicolás de los GarzaNuevo Leon14°–28°412kNov
- 51TonaláJalisco17°–24°409kDec
- 52Ojo de AguaMexico14°–20°386kFeb
- 53Benito JuárezMexico City10°–15°385kFeb
- 54XicoMexico11°–17°384kFeb
- 55IztacalcoMexico City14°–20°384kFeb
- 56MazatlanSinaloa21°–28°382kMar
- 57IrapuatoGuanajuato16°–24°381kDec
- 58Miguel HidalgoMexico City12°–17°373kFeb
- 59TapachulaChiapas22°–25°354kJan
- 60VillahermosaTabasco23°–30°354kJan
- 61CelayaGuanajuato15°–23°340kDec
- 62CuernavacaMorelos14°–20°339kFeb
- 63TepicNayarit19°–25°333kJan
- 64Ciudad VictoriaTamaulipas14°–25°332kNov
- 65Soledad de Graciano SánchezSan Luis Potosi12°–21°332kFeb
- 66Ciudad ObregónSonora17°–32°329kJan
- 67IxtapalucaMexico11°–17°322kFeb
- 68CoatzacoalcosVeracruz23°–28°311kFeb
- 69TampicoTamaulipas20°–28°309kFeb
- 70Ciudad Benito JuárezNuevo Leon15°–30°308kNov
- 71TláhuacMexico City11°–17°305kFeb
- 72Santa CatarinaNuevo Leon13°–25°304kMar
- 73UruapanMichoacan13°–18°300kMar
- 74CholulaPuebla15°–20°293kFeb
- 75Nicolás RomeroMexico13°–19°282kFeb
- 76ZumpangoMexico14°–20°280kFeb
- 77CoacalcoMexico14°–20°278kFeb
- 78NogalesSonora9°–26°265kApr
- 79Gómez PalacioDurango15°–29°257kNov
- 80Los MochisSinaloa19°–31°257kJan
- 81Pachuca de SotoHidalgo12°–17°257kFeb
- 82Oaxaca16°–20°255kDec
- 83La PazBaja California Sur19°–28°250kApr
- 84Colonia del ValleMexico City12°–17°250kFeb
- 85TehuacánPuebla14°–19°249kFeb
- 86Magdalena ContrerasMexico City10°–15°238kFeb
- 87Puerto VallartaJalisco20°–24°224kMar
- 88Campeche24°–29°220kJan
- 89BuenavistaMexico12°–17°217kFeb
- 90Ciudad AcuñaCoahuila12°–31°216kNov
- 91San Cristóbal de las CasasChiapas17°–21°216kJan
- 92JiutepecMorelos14°–20°215kFeb
- 93MonclovaCoahuila14°–29°215kNov
- 94CórdobaVeracruz14°–20°205kJul
- 95Cabo San LucasBaja California Sur20°–27°203kMay
- 96Ciudad MaderoTamaulipas20°–28°197kMar
- 97Ciudad Lázaro CárdenasMichoacan25°–28°196kFeb
- 98Ciudad del CarmenCampeche24°–28°191kFeb
- 99ChilpancingoGuerrero18°–22°187kDec
- 100Zamora de HidalgoMichoacan15°–22°186kDec
- 101Poza Rica de HidalgoVeracruz19°–28°185kJan
- 102CuautitlánMexico13°–19°179kFeb
- 103San Luis Río ColoradoSonora14°–34°177kFeb
- 104San Miguel de AllendeGuanajuato14°–22°175kFeb
- 105ChicoloapanMexico14°–20°173kFeb
- 106GuadalupeZacatecas12°–20°170kMar
- 107ChetumalQuintana Roo24°–28°169kFeb
- 108ChalcoMexico11°–17°169kFeb
- 109CuauhtémocChihuahua7°–22°168kApr
- 110ComitánChiapas19°–22°166kJan
- 111SalamancaGuanajuato16°–24°161kDec
- 112Delegación Cuajimalpa de MorelosMexico City10°–15°160kFeb
- 113ManzanilloColima24°–28°160kMar
- 114TuxtepecOaxaca21°–28°159kJan
- 115CuautlaMorelos20°–26°157kJan
- 116San Pablo de las SalinasMexico14°–20°156kFeb
- 117San Martin Texmelucan de LabastidaPuebla11°–16°156kFeb
- 118Piedras NegrasCoahuila13°–31°150kNov
- 119Playa del CarmenQuintana Roo24°–28°150kMar
- 120Ciudad DeliciasChihuahua12°–29°148kFeb
- 121CozumelQuintana Roo24°–28°77kMar
- 122Guanajuato14°–22°72kFeb
- 123ZihuatanejoGuerrero23°–26°67kJan
- 124Chiapas20°–24°45kJan
- 125PalenqueChiapas22°–29°43kDec
- 126LoretoZacatecas13°–22°24kFeb
- 127TulumQuintana Roo24°–28°18kMar
- 128Chichen ItzaYucatan23°–28°18kJan
- 129Isla Mujeres24°–28°13kMar
- 130Bacalar24°–28°12kJan
- 131Tlacotalpan22°–29°8kJan
- 132Todos Santos19°–26°5kMar
- 133San Carlos17°–32°2kJan
- 134Sayulita23°–28°2kMar
- 135Taxco24°–30°2kJan
- 136El Tajín19°–28°1kJan
- 137Ek Balam23°–29°1kJan
- 138Teotihuacan12°–17°0kFeb